Introduction#
This package offers a variety of classifiers for the IQ readout from superconducting qubits, as well as plotting functionality to have an overview of their performance and a documentation guide explaining the ins and outs of the theory behind each classifier.
The sections below will go through all the steps needed to
install this package
set up the classifiers
get an overview of their performance
use the classifiers to predict the state of the qubits
Installation#
This package can be installed directly from the PyPI repository via
pip install iq_readout
Alternatively, it can be installed from source via
git clone git@github.com:MarcSerraPeralta/iq_readout.git
pip install iq_readout/
Setting up the classifiers#
The data extracted from qubit readout calibration is a set of IQ points for each state the qubit was prepared on before measurement. It can be structured as
shots_0: a numpy array of shape(num_shots_0, 2)with the IQ points when the qubit was prepared in state 0.shots_1: a numpy array of shape(num_shots_1, 2)with the IQ points when the qubit was prepared in state 1.…
Complex IQ arrays can be converted to the format above using iq_readout.utils.from_complex.
Currently, IQ readout supports up to three-state discrimination classifiers.
Setting up a classifier can be done via
from iq_readout.two_state_classifiers import DecayLinearClassifier

# load readout calibration data
shots_0, shots_1 = ...

# fit the classifier
clf = DecayLinearClassifier.fit(shots_0, shots_1)
Classifier performance summary#
The performance of a classifier can be summaried using the iq_readout.plots.summary function.
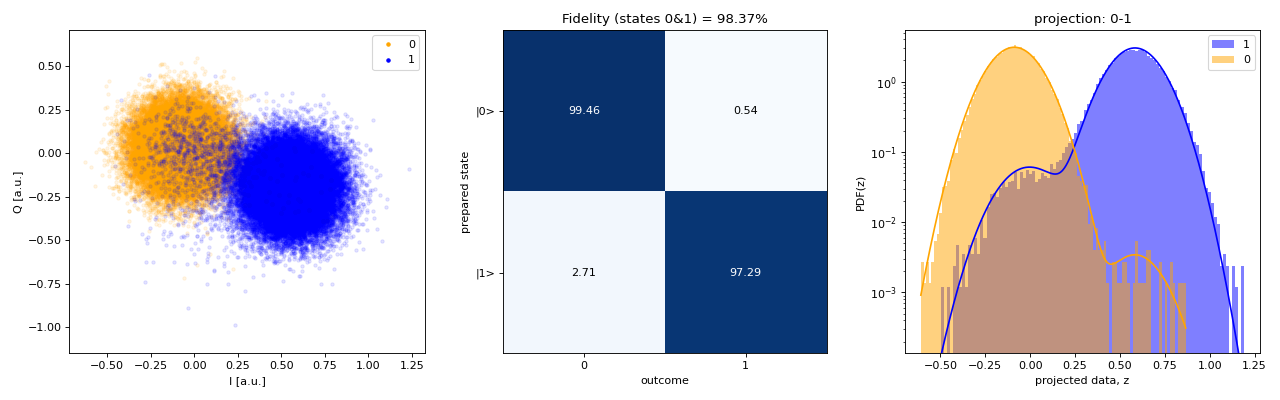
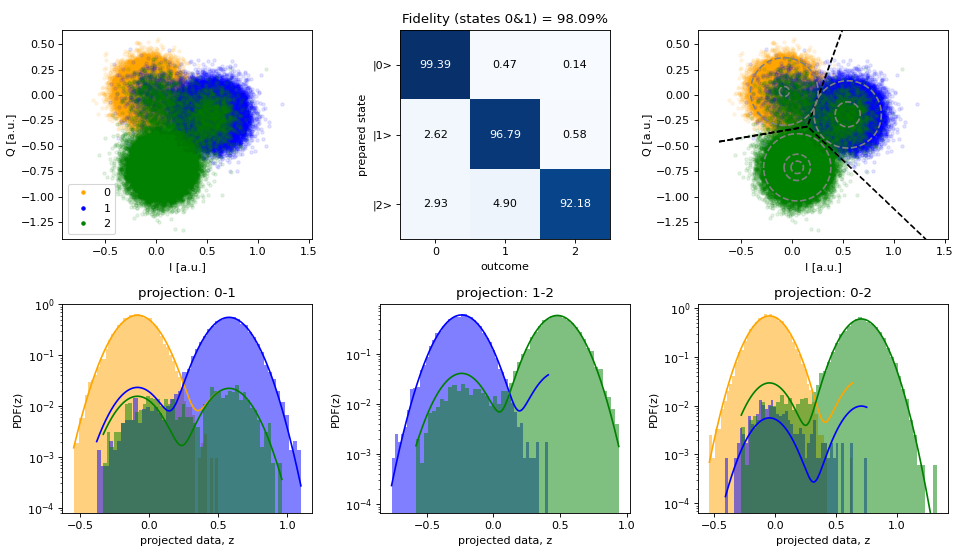
The generated figure contains the readout calibration IQ points, the \(p(m|p)\) matrix, and the
fitted probability density functions.
import matplotlib.pyplot as plt
from iq_readout.plots import summary

fig = summary(clf, shots_0, shots_1)
plt.show()
An example of the output for a two-state classifier is
An example of the output for a three-state classifier is
Tip
One can create their own summary functions from the building blocks inside
iq_readout.plots.shots1d, iq_readout.plots.shots2d and
iq_readout.plots.metrics.
Infering the qubit state#
Once the classifier is set up and its performance is up-to-standards, it can be used to
predict the qubit state from the IQ data.
This can be achieved by the predict method from the classifiers.
import numpy as np

# (fake) IQ data
# where iq_data[..., 0] = I data
# and   iq_data[..., 1] = Q data
iq_data = np.random.rand(123, 456, 2)

outcomes = clf.predict(iq_data)
# outcomes.shape = (123, 456)
Note
In the iq_readout package, the data is expected to have the IQ dimensions as
the last dimensions of the numpy arrays, i.e. data.shape = (..., 2)
Further information#
For more information about the theoretical background of the classifiers, see Classifiers.
For more information about the use of the package, see API reference.